
From Advanced Excel & Complex SQL to Power BI Desktop, DAX Modeling, Tableau Data Storytelling, Python EDA & Generative AI for Analysts.



















Get Syllabus, Fees & Batch Timings
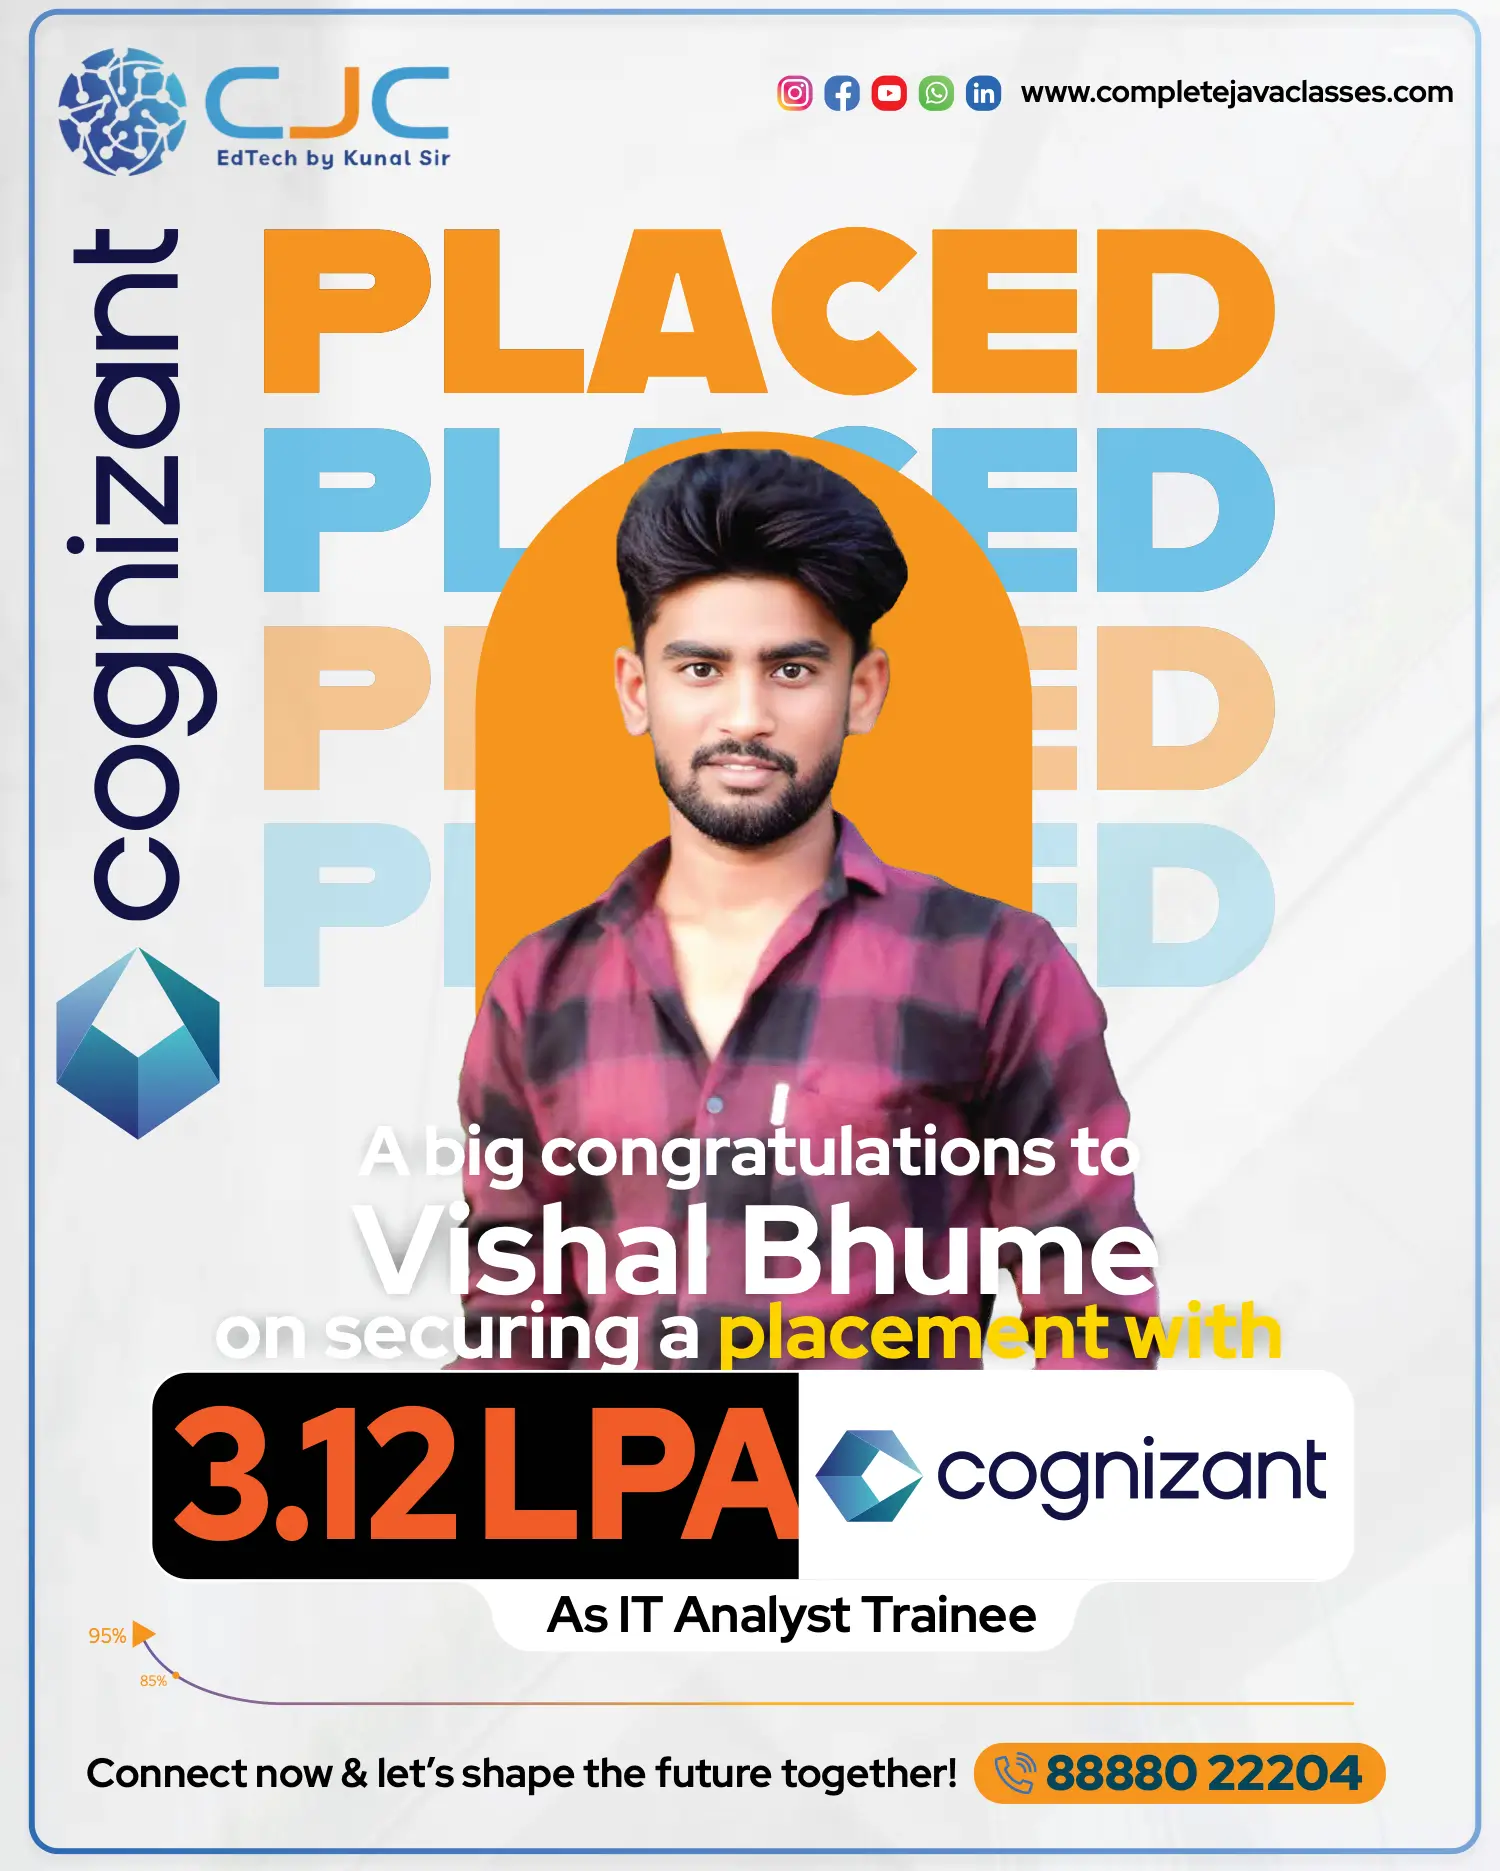
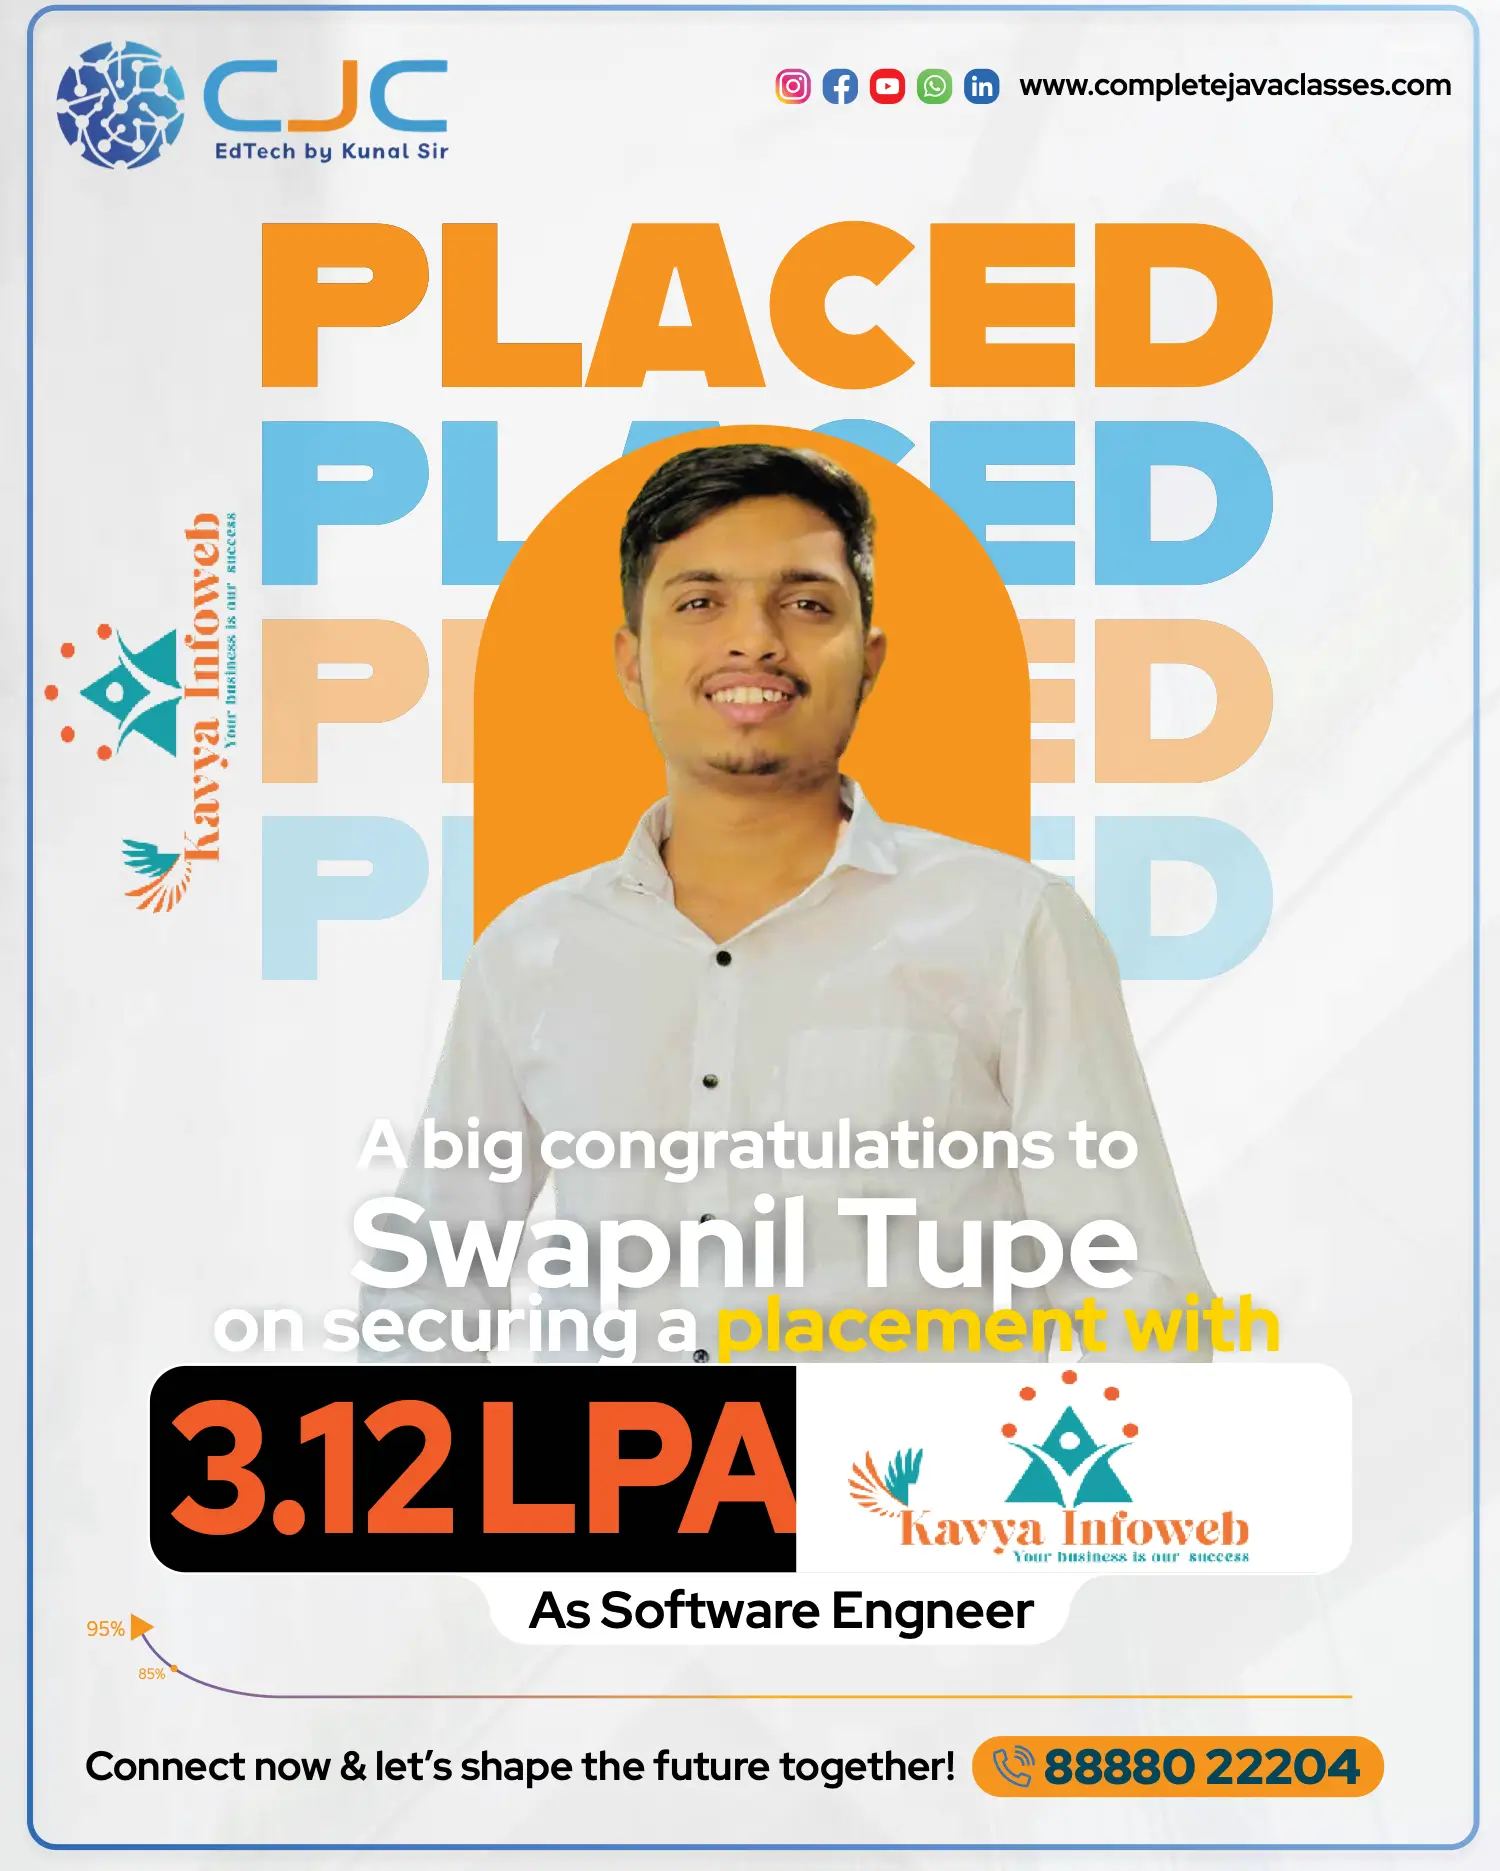
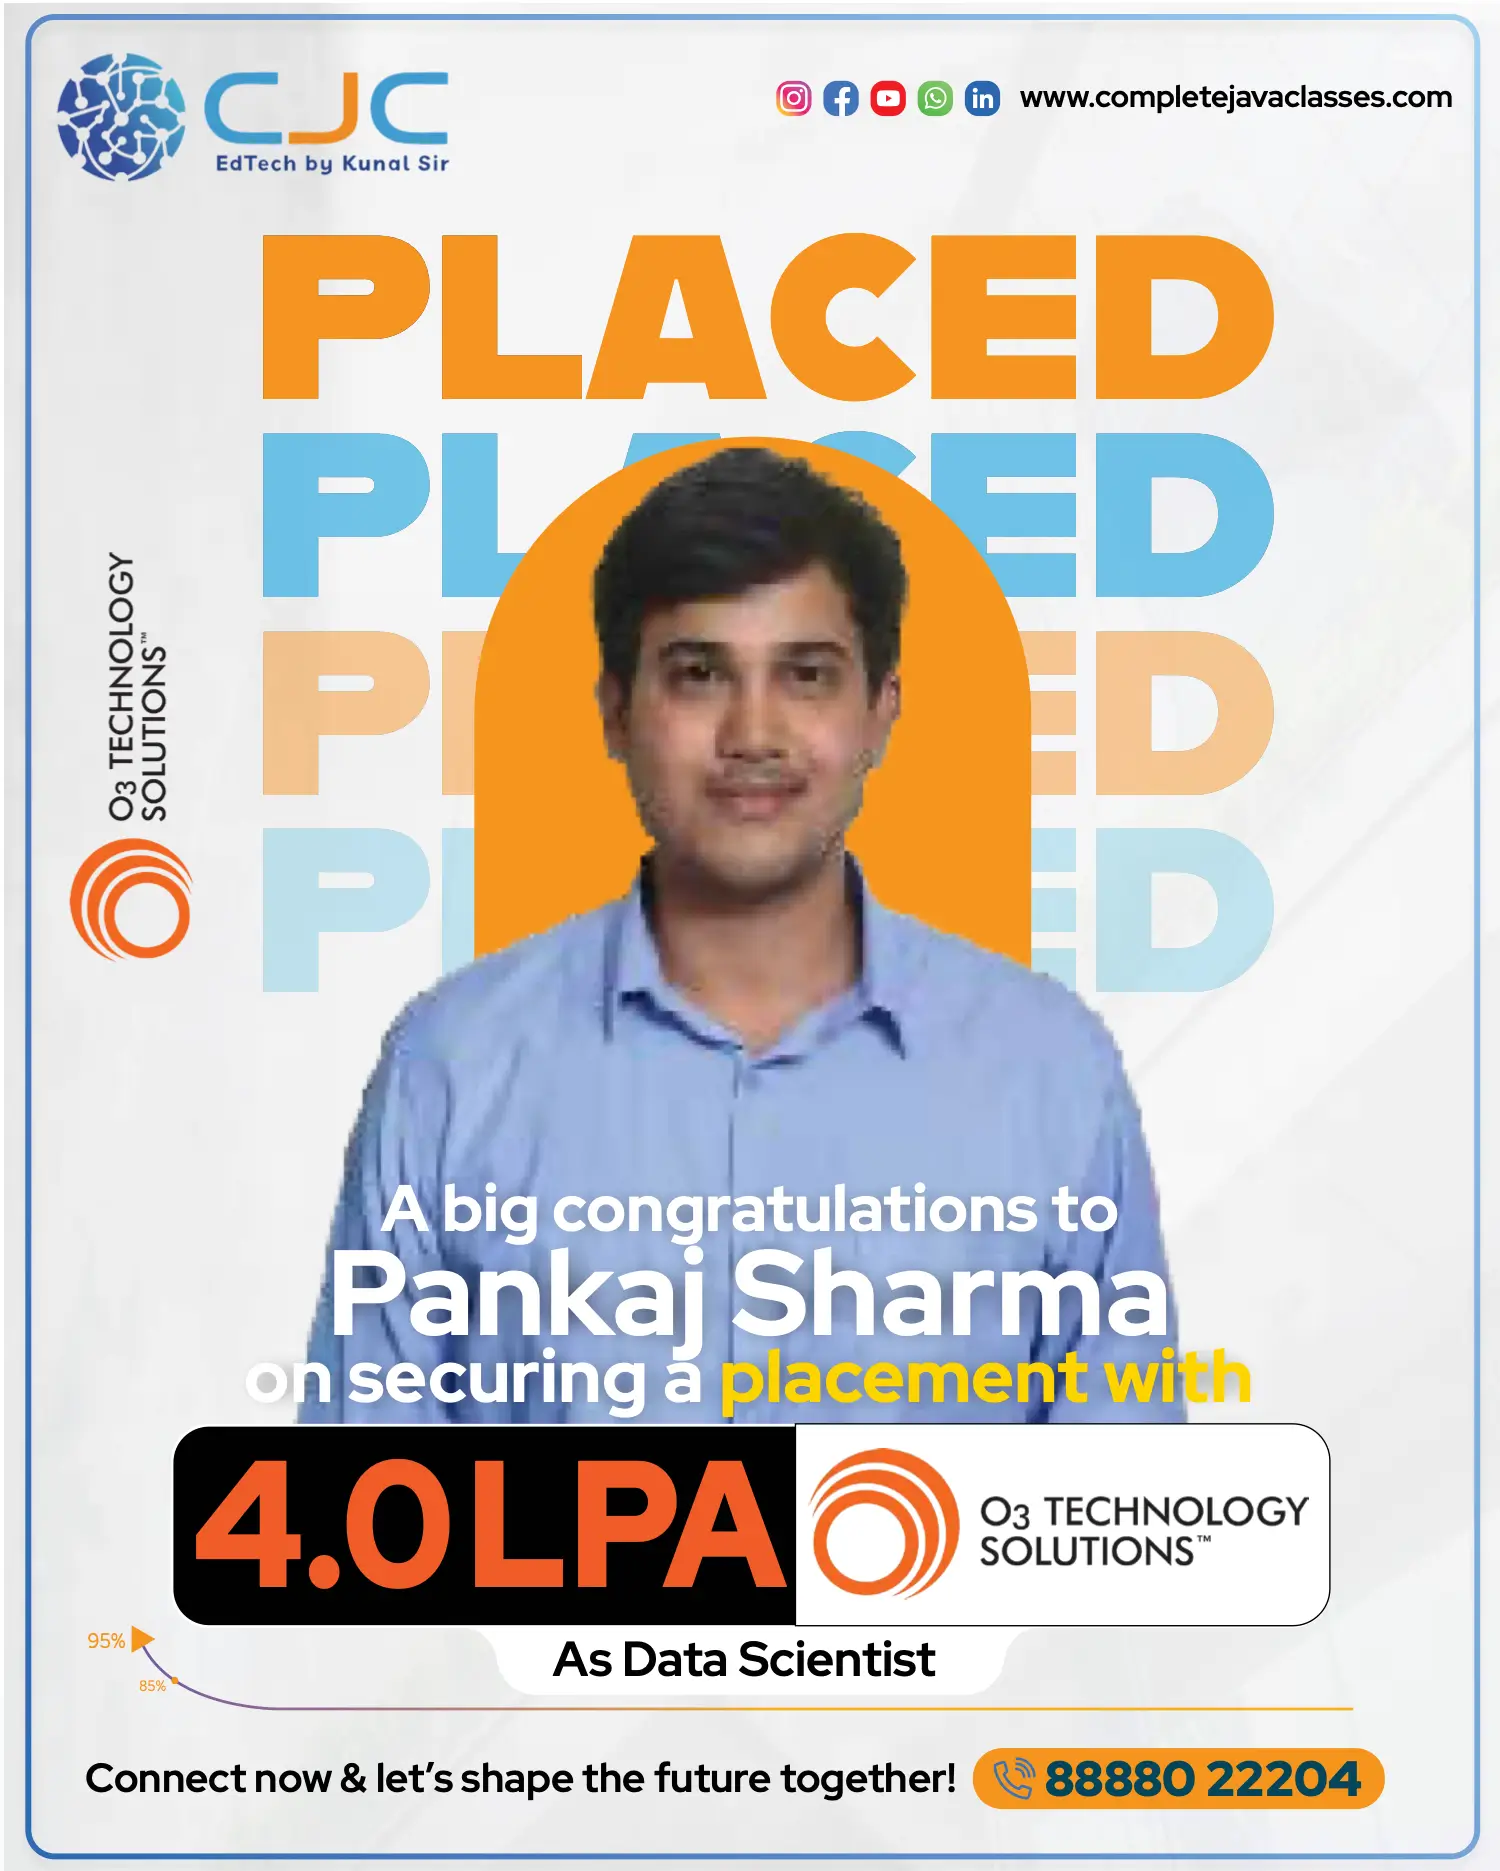
Over 2,300+ CJC Graduates are working as Business Analysts, Power BI Developers & Data Consultants across Pune, Bengaluru, Hyderabad & Mumbai.









Watch how freshers and non-IT switchers built production BI dashboards and cracked 5 LPA to 10.5 LPA packages.















Data Analytics requires zero prior programming knowledge, making it the highest ROI career transition for any educational background.
BCom, BBA, BSC, BCA, BE, BTech graduates looking to enter high-growth data roles without heavy algorithmic programming.
Sales, marketing, operations, finance, and accounting professionals wanting to transition into high-paying Business Analyst & BI Consultant roles.

Professionals currently working with manual Excel reporting who want to automate dashboards with Power BI, SQL, and GenAI copilot tools.
Candidates with education or employment gaps of 1 to 6+ years. Real-world business projects help you justify gaps effectively in interviews.
Build interactive executive dashboards, automate ETL workflows, and present data-driven business stories.
Designed multi-page Power BI executive suite tracking $45M+ revenue across 14 global territories with YoY growth KPIs, RFM customer segmentation, and dynamic currency conversions.
Constructed interactive Tableau dashboard analyzing 120,000+ loan applications with Level of Detail (LOD) expressions, delinquency probability maps, and compliance audit reports.
Engineered end-to-end data pipeline using PostgreSQL window functions and Python Pandas to identify warehouse bottleneck lead-times and predict supplier fulfillment stockouts.
Master Power BI, Tableau, Advanced SQL, Excel, and GenAI with practical business datasets and 100% placement support.
Direct campus interviews with 300+ hiring partners for Data Analyst, Business Analyst, and BI Consultant positions across Pune and pan-India.

Unlike other institutes that teach only one tool, CJC covers BOTH Microsoft Power BI and Tableau with real enterprise licenses and dataset case studies.
Deep dive into complex joins, Window functions (ROW_NUMBER, DENSE_RANK, LEAD/LAG), CTEs, query optimization, and stored procedures.
Learn how to leverage ChatGPT, Claude, and Microsoft Copilot to write complex DAX formulas, debug SQL queries, and synthesize executive insights 3x faster.

Work with real, messy business data from banking (credit card defaults), e-commerce (sales funnel), and supply chain logistics, not dummy sample rows.

Weekly portfolio reviews, live business case presentations, and technical mock interviews that make you 100% confident in MNC interview rounds.

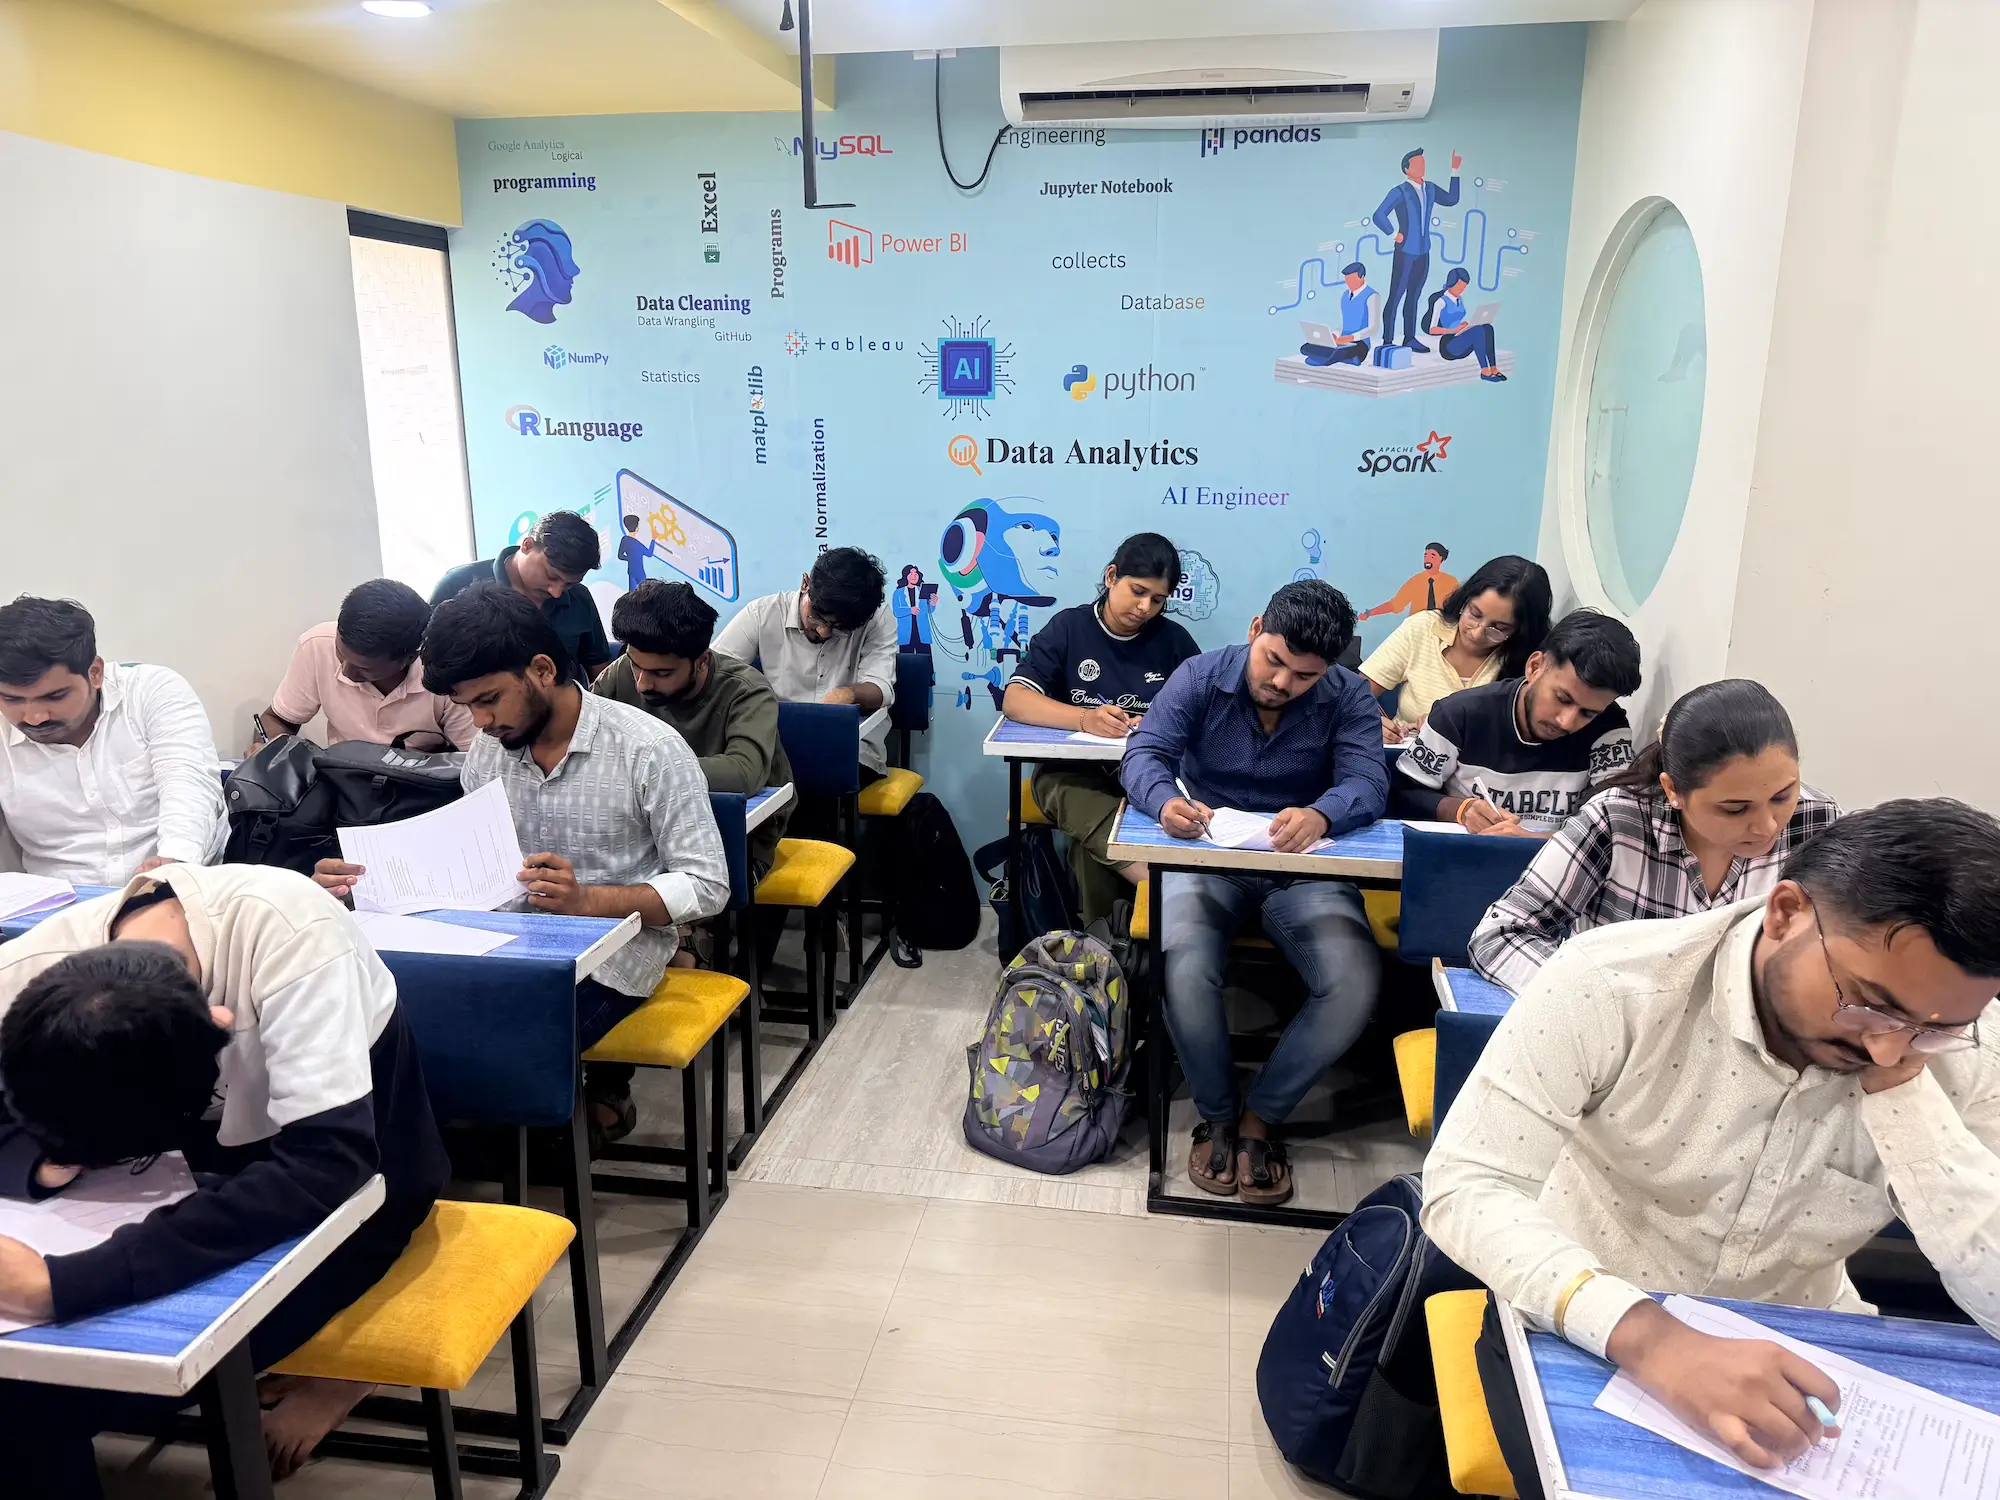
Real classrooms. Live mentorship. Practical learning.

Click each module below to view all topics, enterprise project milestones, and hands-on exercises covered in class.
Master modern Excel functions: Dynamic Arrays, XLOOKUP, Nested Logical formulas, What-If analysis, Interactive Pivot Tables, and automated Power Query data transformations.
Write complex SQL queries on multi-million row databases. Master Inner/Outer joins, Window functions, Common Table Expressions (CTEs), and performance tuning.
Transform raw disorganized data using Power Query, architect Star and Snowflake dimensional schemas, and configure active/inactive relationships for enterprise reporting.
Master DAX evaluation context (Row Context vs Filter Context), context transition with CALCULATE(), and build complex Time Intelligence measures (YTD, MTD, YoY growth).
Build interactive visualizations with Tableau Desktop, configure Level of Detail (LOD) calculations (FIXED, INCLUDE, EXCLUDE), and present executive storyboards.
Learn essential Python for analytics: clean datasets with Pandas, compute statistical summaries with NumPy, and create publication-ready charts using Matplotlib & Seaborn.
Supercharge productivity with GenAI prompt engineering for SQL and DAX, build an enterprise GitHub & NovyPro dashboard portfolio, and crack MNC technical interviews.
Includes day-by-day lecture breakdowns, SQL query practice sets, Power BI DAX cheat sheets, and mock evaluation checklists.
Join our classroom batches at Karvenagar or Akurdi, or attend live interactive online sessions.
Ideal for working professionals and students wanting to master Advanced Excel, SQL, and Power BI dashboards with flexible timings.
Our flagship 5.5 months intensive program covering Power BI, Tableau, SQL, Python, GenAI, and dedicated placement support.
Saturday & Sunday intensive live sessions designed specifically for working professionals looking to transition into Business Analytics.
Everything you need to know about CJC's Data Analytics & Business Intelligence Master Program.

Get clear answers about Power BI, Tableau, SQL, placements and fees.
Not at all! Data Analytics is designed specifically for students and professionals who do not have a computer science or programming background. The primary tools are Excel, SQL, and visual business intelligence tools like Power BI and Tableau.
CJC provides 100% placement support through direct recruitment drives with our 300+ hiring partners in Pune, Mumbai, and Bengaluru. We conduct daily mock interviews, optimize your LinkedIn and resume, and guide you in building an attractive public project portfolio.
Yes! Both market-leading Business Intelligence tools are included. You will build live capstone dashboards in Power BI Desktop (with DAX and Power Query) as well as Tableau Desktop (with LOD expressions and Story Points).
Freshers typically receive starting packages ranging from 4.5 LPA to 8.5 LPA in roles like Junior Data Analyst, Business Analyst, and Power BI Developer. Experienced professionals and career switchers command packages between 7 LPA and 12+ LPA.
You build 3 live enterprise projects: a $45M Retail Sales Performance Dashboard in Power BI with DAX, a BFSI Loan Default & Credit Risk Cockpit in Tableau, and a Supply Chain inventory optimization pipeline with PostgreSQL and Python.
Modern analysts use GenAI tools like ChatGPT, Claude, and Microsoft Copilot to rapidly write complex SQL queries, troubleshoot intricate DAX formulas, summarize statistical trends, and draft executive email briefings.